Practical Course Materials Science
Procedure
Testing procedure:
- Introduction
- Specimen preparation: Measuring the specimen
- Specimen preparation: Welding the thermocouple
- Dilatometer setup
- Assembling the specimen
- Experiment parameters
- Performing the test
- End of experiment
You may use the items as chapter navigation.
More informations behind the icon
Result of measurement
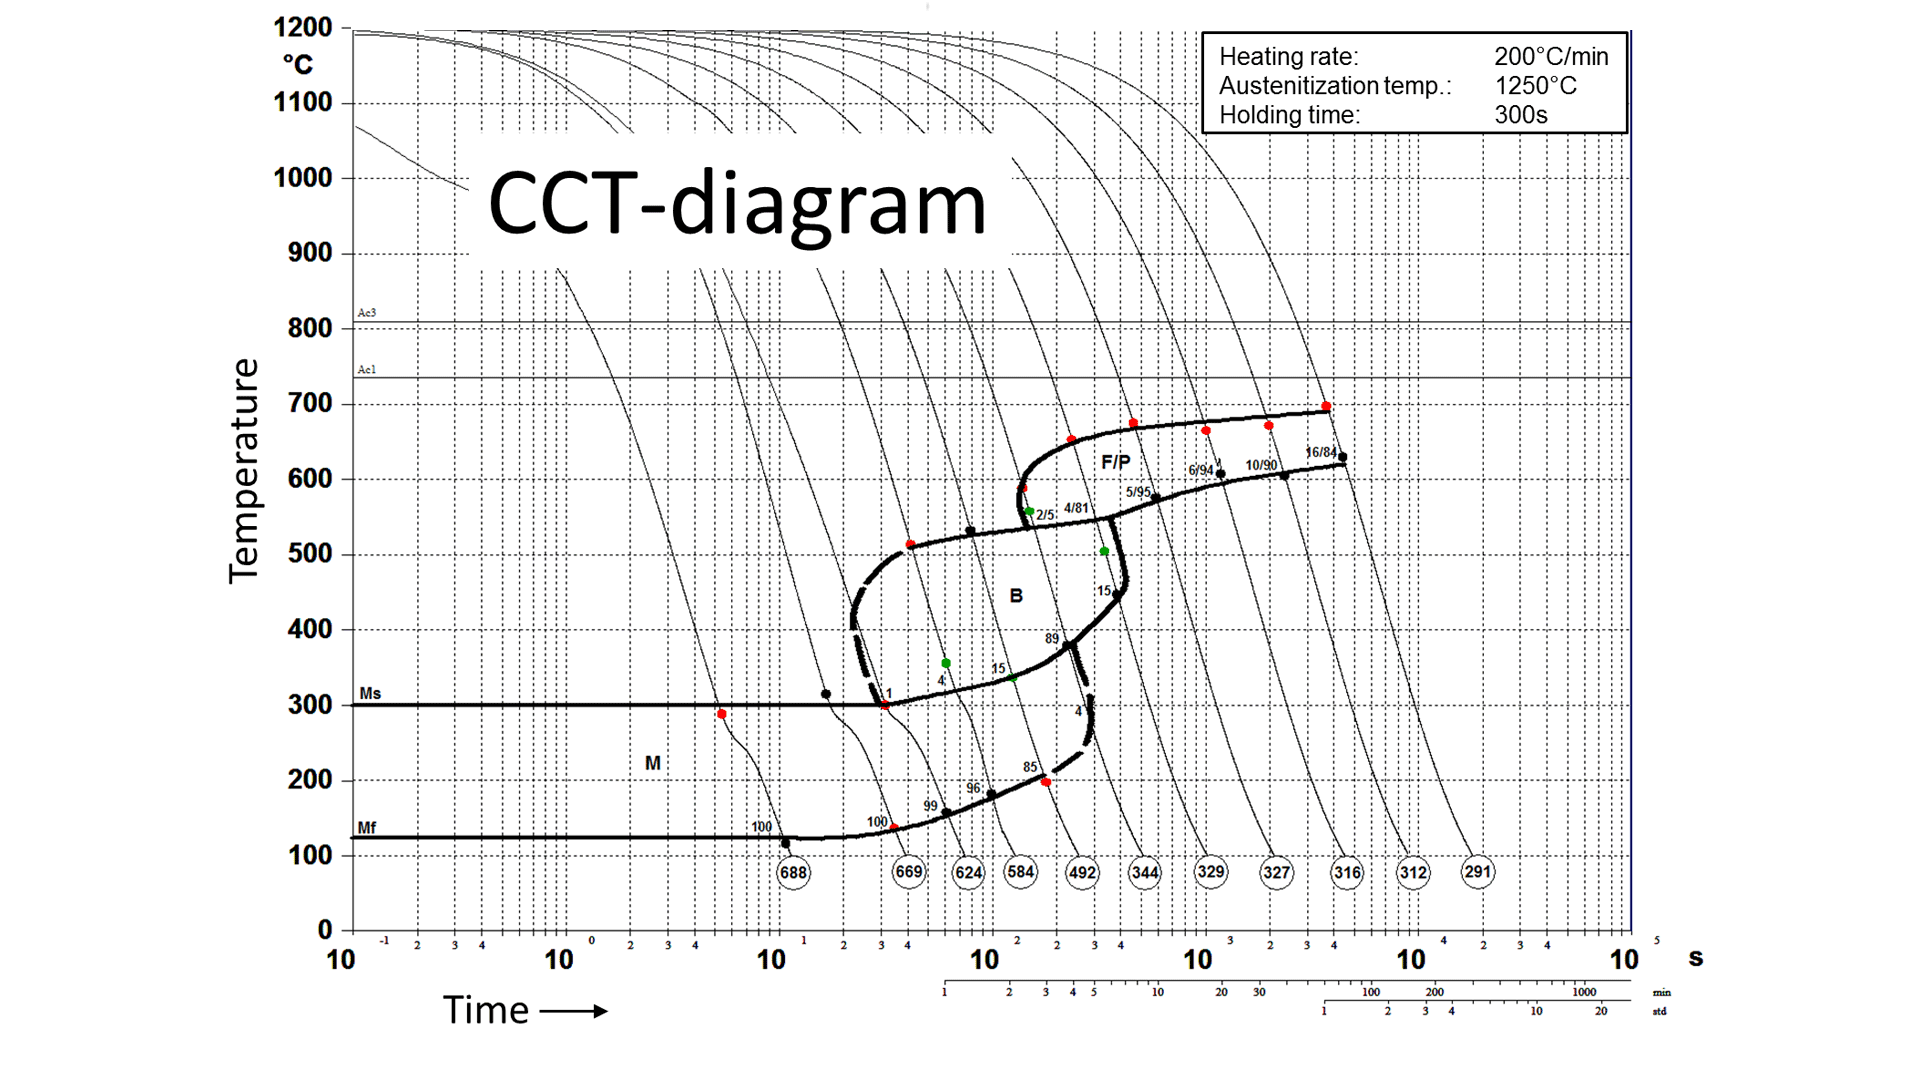
CCT diagram
Result of measurement
During the practical course "Dilatometry" we have performed a measurement to characterize the phase transformation behavior of a material by a length change measurement in dependence on time and temperature.
After performing 12-14 tests with different test parameters, the specimens have to be further analyzed by metallography and hardness measurement.
The final result is a phase transformation diagram of the material.
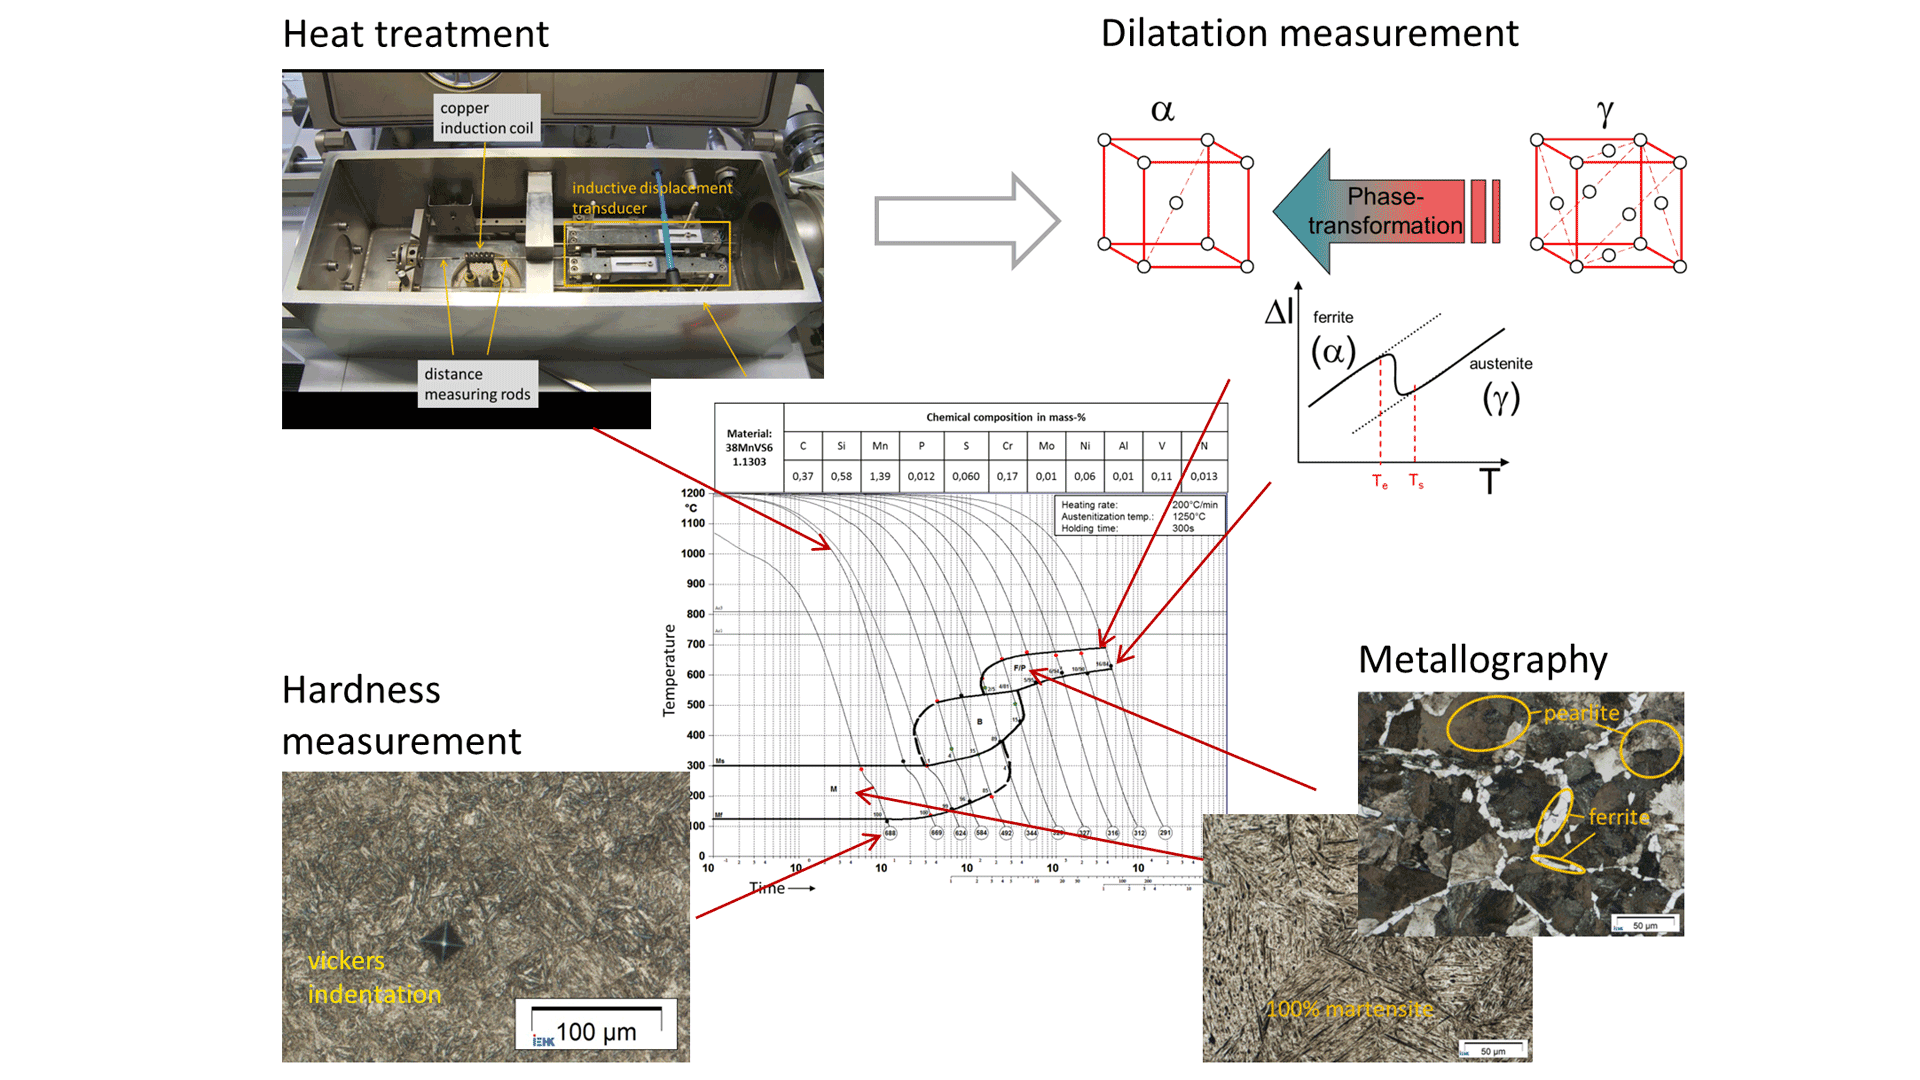
Evaluation
- Step 1:
Plot the measured data as length-change vs. temperature - Step 2:
Use the tangent method determine the transformation temperatures - Step 3:
Determine the volume fraction of microstructural constituents of each specimen by metallographic analysis - Step 4:
Do a hardness measurement on each specimen - Step 5:
Combine the evaluated data and draw a phase transformation diagram
Practice
Checklist the steps
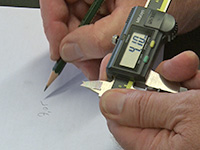
Measuring
- Measuring and recording the dimensions of the specimen.
Notice The dimensions have to be measured carefully, which is necessary for the determination of the relative length change afterwards.
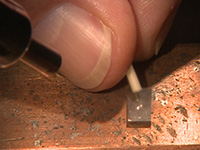
Welding the thermocouple
- Spot-welding a type-S thermocouple.
Notice The distance between the welded points should be as close as possible without contacting each other.
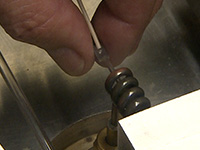
Assembling the specimen
- Plugging in the thermocouple.
- Placing the specimen between the two displacement measuring rods carefully.
- Moving both in the center of the induction coil.
- Closing the chamber.
- Starting the vacuum pump.
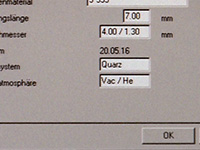
Defining the experiment parameters
- Specifying a heat treatment cycle with heating time, holding time and cooling time.
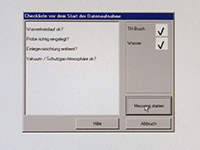
Performing the test
- Checking the system.
- Starting the measurement.
- Observing the test and curve (temperature, length change).
- After cooling down: Dismounting of the specimen.